Tags: #architecture #ashrae #buildingdesign #buildingscience #hygrothermal #resilience #waterresistance
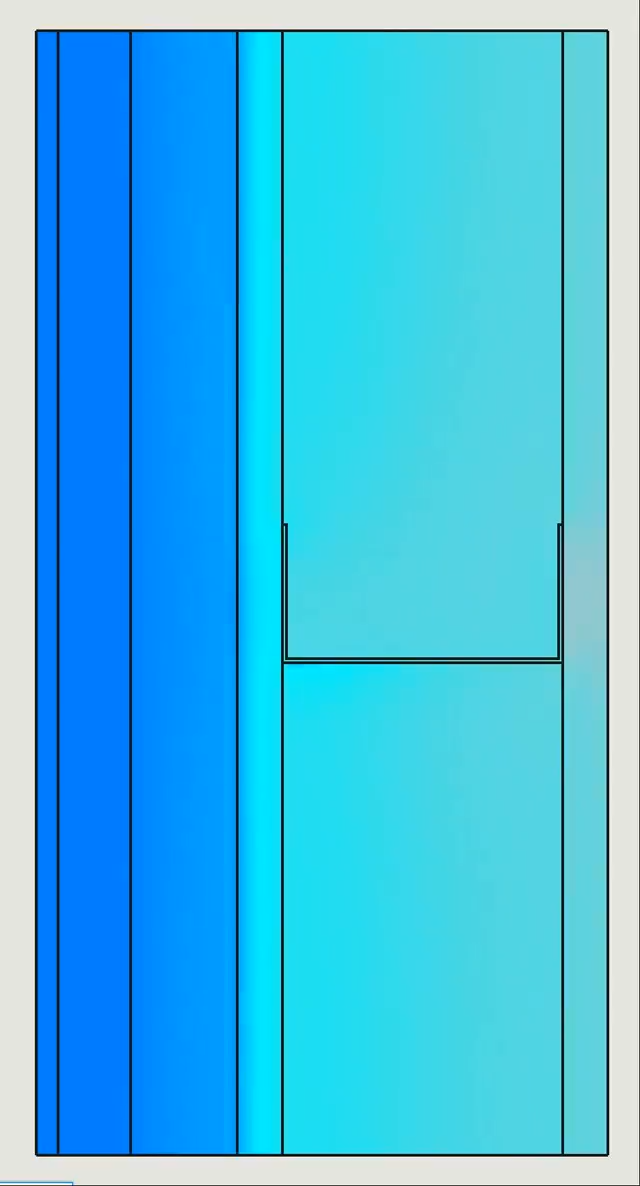
Visualizing storm events in hygrothermal simulations: Part 2 – a 2D plot of a vapor-open wall assembly.
As a follow-up to my last post, I’m presenting the 2D visualization of severe weather. The simulated year corresponds to 1983 – the same year Hurricane Alicia hit the Galveston-Houston areas.
I’ve purposely modeled a very vapor open wall assembly comprising of mineral wool exterior insulation, a gypsum-based WRB panel, and cavity-filled insulation. In terms of R-value, this wall would represent a minimum code-compliant configuration based on today’s standards.
Dark blue represents >90% RH. The lighter blue represents >80% RH. Hurricane Alicia made landfall on August 17/18, but significant rainfall had occurred in weeks prior. We see that by mid-month, the assembly is already spiraling downward. And for the remainder of that month, it never recovers.
Water resistance of AWB’s is important. And even the most vapor-open wall will not dry if inundated with bulk water.