Tags: #architecture #buildingdesign #buildingdurability #buildingmaterials #buildingproducts #buildingscience #buildingsimulation #climate #hygrothermal #materialsscience #resilience
I’m intrigued with conveying data differently, in ways that make information easier and faster to grasp – or at the very least, a bit more interesting.
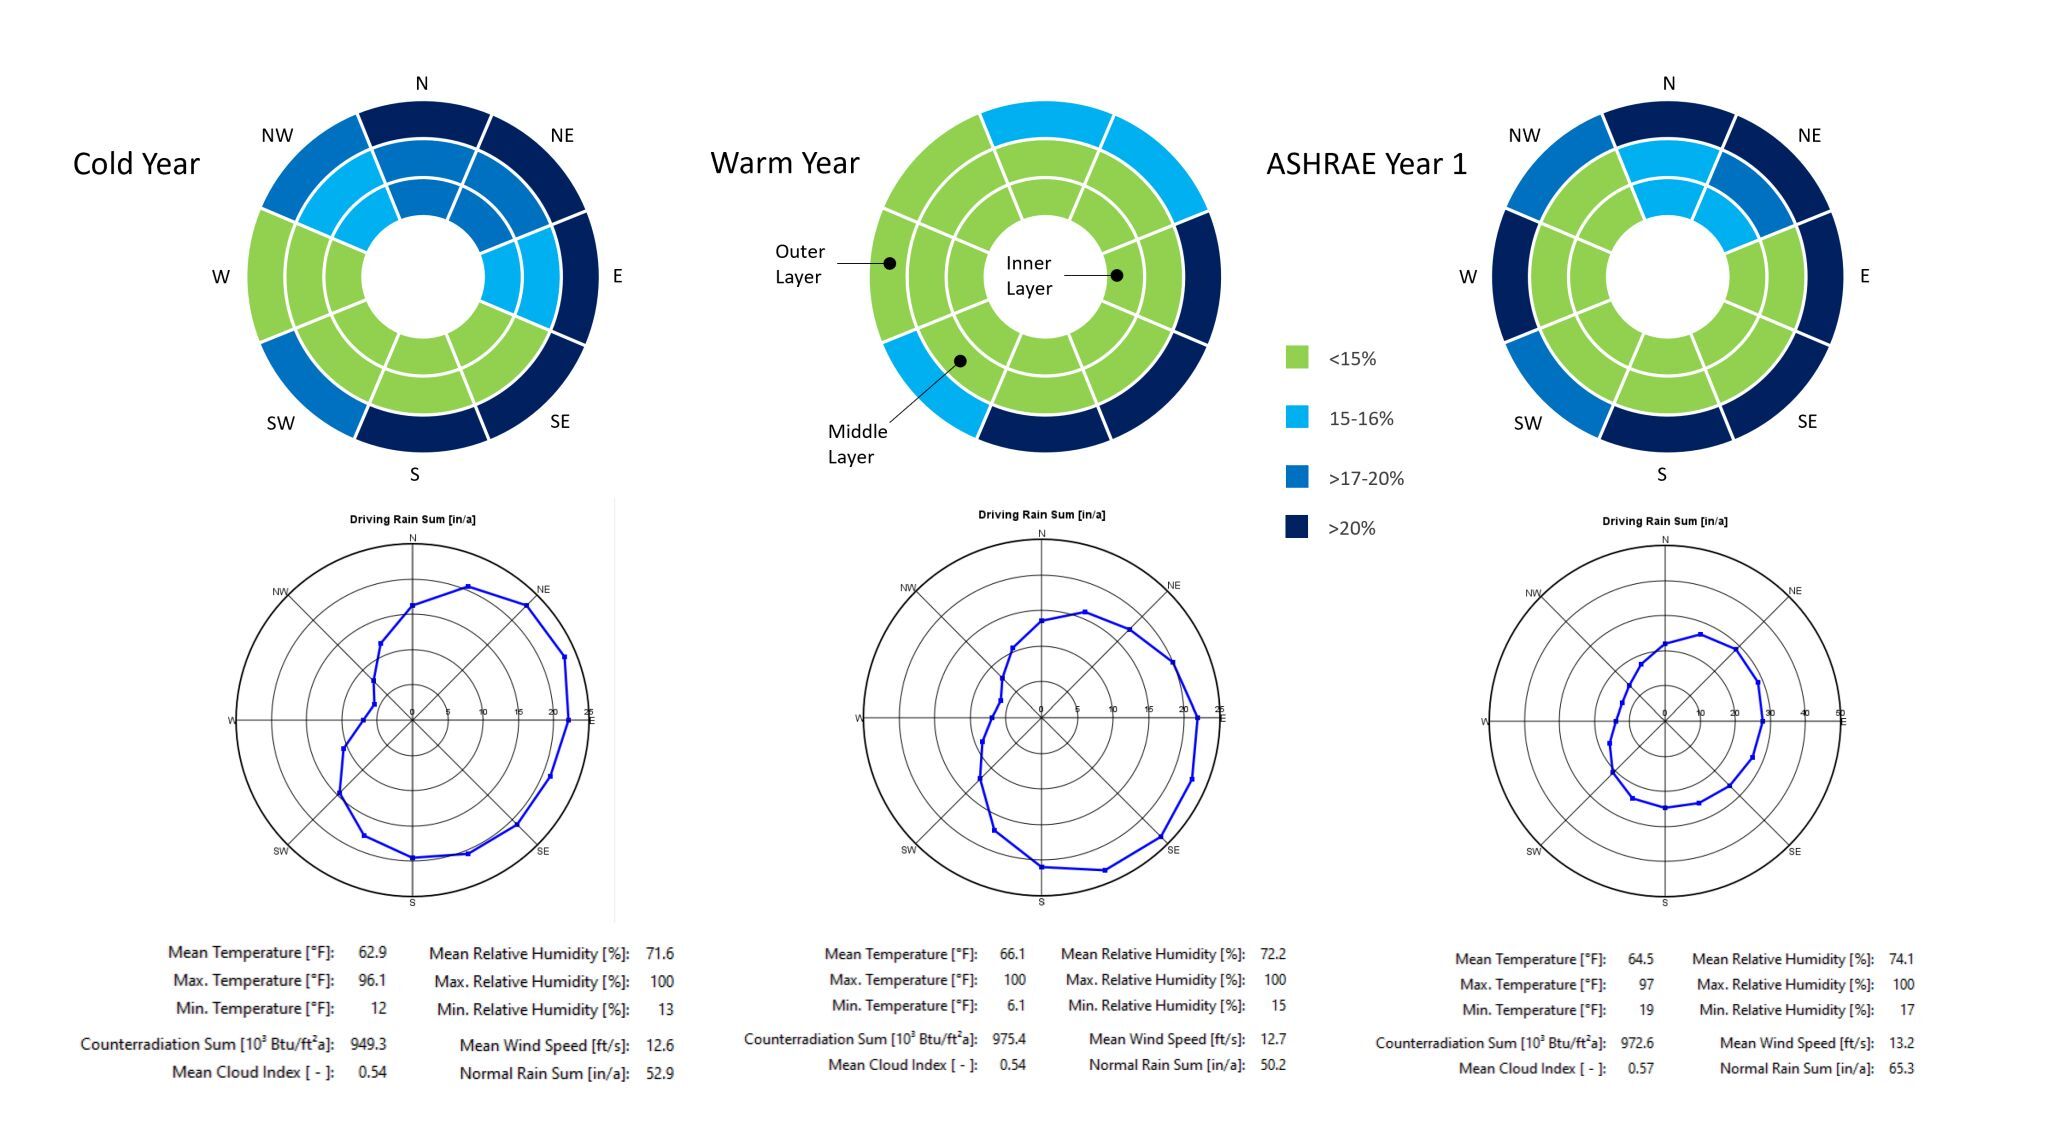
Here, I show how simple post-processing of WUFI data can provide a snapshot of several complex variables and conditions. This single graphic conveys outcomes from 24 analyses encompassing all cardinal and ordinal directions for three building layers. Each layer pertains to either the outer, middle, or inner layer of a wood based integrated WRB panel.
The modeled outcomes represent peak wood moisture content from 1-year analyses for Charleston, SC. I include three datasets: the Cold Year, Warm Year, and ASHRAE Year 1. Each dataset varies by direction of prevailing wind, total rain, and total driving rain. For the modeled wall assembly, I’ve placed a 1% wind-driven rain fraction within the entire thickness of outer panel layer – to account for an untreated fastener overdriven by 30%. By outer panel, I mean I have taken the sheathing and divided it into three layers with each having the same thickness. This achieves a more accurate accounting of wood moisture content when analyzed on a mass basis.
The results demonstrate how important it is to consider orientation in combination with climate dataset. North isn’t always the most arduous nor is the windward elevation. Likewise, ASHRAE Year 1 doesn’t always present the greatest risk when assessing the greater assembly. There’s a balance at play. For example, the effects of wind-driven rain can be countered by solar radiation. The obvious is also shown. Fasteners should be treated.